![]()

ASPIRE. ENGAGE. EXCEL.
Civic Health Report
Dr. Susan Orr
Dr. Dena Levy
Ashley Burek
Krishaon Ewing
Allyson Kehl
![]()
TABLE OF CONTENTS


- Introduction
- Measuring Civic Health
- Demographics
- Dimensions of Civic Health
- Service
- Participation in Groups
- Connecting to Information and Current Events
- Social Connectedness
- Political Action
- Conclusions and Suggestions for Further Research
- Thank You & Acknowledgements
ASPIRE. ENGAGE. EXCEL.

INTRODUCTION
Do college students care about politics? Do they participate in groups? Do they read the newspaper? Do they talk to their neighbors and work together to resolve collective problems? What difference does it make if students do belong to a group, or consume news, talk to each other and help their fellow citizens?
Civic engagement, from Alexis De Tocqueville to Robert Putnam, has been lauded as a hallmark of a healthy polity and a pre‐requisite for a vibrant democracy. Yet there exist conflicting assessments of the extent to which contemporary citizens are effectively civically engaged. Some argue that not only are we “bowling alone,” but we do not read newspapers, talk to our neighbors, help with community problems, let alone vote. Others argue that we need to change the lens of how we define civic participation and that doing so will reveal a vibrant, engaged community of active citizens.
This report is an initial attempt to assess the Civic Health of The College at Brockport. By “Civic Health” we mean the civic, social and political strength of a community. Civic strength is characterized by the level of community involvement and the capacity of a community to work together to resolve collective problems. Social strength captures the social ties, networks, level of trust, and shared understanding in a community. Political strength gauges the extent of citizens’ engagement with government. In this first Civic Health Report we present data addressing most, but not all, aspects of Civic Health. We focus on the College at Brockport student body. In future years we plan to expand the range of indicators we assess and extend the project to include faculty and staff ‐ clearly two important constituencies in the college community.
This project was inspired and aided by the American Democracy Project (ADP) and the National Conference on Citizenship (NCOC). The NCOC works with the Bureau of Labor Statistics (BLS) and U.S. Census Bureau to conduct a national survey to assess the Civic Health of the nation, as well of individual states and localities. They have teamed with ADP to expand their efforts to the campus level with a particular aim of gauging the civic activity of young Americans. This cooperative effort led us to assess the Civic Health of the College at Brockport student body using a survey replicating that used by our national partners. This provides us the ability to place the results from Brockport students within a broader context by comparing them with statistics for citizens nationally, residents of New York state, and for the Millennial generation.
We hope that as you read this report you will reflect on the areas in which the Civic Health of the College at Brockport is strong, as well as those areas in need of improvement. At the end of the report we summarize our impressions of strengths and weaknesses but would like to receive input from others in the college community.
This year, the Civic Health assessment was conducted in part by students in Political Science Research Methods courses. Next year, we will continue to incorporate the project into the curriculum as we gather additional data and create a more robust Civic Health Report. Members of the American Democracy Project on campus will also be working on initiatives to enhance campus Civic Health based on the information presented here. Again, the committee would welcome your ideas and insights. Happy reading, and please share with us your thoughts and reactions.

HOW DO WE MEASURE “CIVIC HEALTH”?
“Civic Health” is an umbrella term that incorporates various dimensions of civic engagement. It attempts to capture the actions that citizens, either individually or collectively, choose to take (or refrain from taking) to serve the common good and make their community more vibrant and prosperous. Civic Health includes, but goes beyond citizens’ political engagement. Indeed an assessment of a communities Civic Health seeks to measure the civic, social and political strength of a community.
Civic strength is characterized by the level of community involvement and the capacity of a community to work together to resolve collective problems. Social strength captures the social ties, networks, level of trust, and shared understanding in a community. Political strength gauges the extent of citizens’ engagement with government. Clearly these different facets of Civic Health interact and reinforce one another, for example a community with high levels of trust and strong social ties is likely to have higher levels of political engagement.
In order to collect and organize data evaluating the Civic Health of The College at Brockport we divided the civic, social and political components of Civic Health into five dimensions or sets of indicators. The brief descriptions below provide a summary of the kinds of actions measured in each dimension – the sections that follow provide more detailed descriptions and present our data.
Service – this dimension of civic health includes both formal and informal ways of serving the community. Formal participation is working as a volunteer through an organization while informal service is working with neighbors to fix a community problem.
Participating in a Group – this dimension of civic health assesses how many members of a community participate in associations or community organizations.
Connecting to Information and Current Events – this dimension of civic health assesses how many members of a community access information about politics and current events either through traditional news sources – print, radio, TV – or via on‐line formats.
Social Connectedness ‐ This dimension assess informal activity that fosters community relationships and communication. These activities include such things as eating dinner with friends and family, talking to neighbors and doing favors for others.
Political Action – This dimension of civic health includes electoral participation such as voting and voter registration as well as more active forms of political engagement such as boycotting products or attending political meetings.
ABOUT THE COLLEGE AT BROCKPORT AND OUR DATA
The College at Brockport is a comprehensive public college offering both undergraduate and graduate education. The college is located in the village of Brockport NY, a town of 8,100 residents located on the historic Erie Canal. The village of Brockport is located in Monroe County 16 miles from downtown Rochester, 45 miles east of Buffalo, and just a short drive from the Canadian border.
The College at Brockport campus comprises 464‐ acres with 67 buildings occupying about one‐quarter of that area, and rolling grassy fields and wooded land the remainder. Founded in 1835, as a “normal school” focused on teacher education, The College at Brockport now offers 49 undergraduate majors, 47 master’s degree programs, and teacher certification in 24 areas. Each year, The College at Brockport awards approximately 25% of all bachelor degrees in the Rochester area, with many alumni staying in Rochester to work or attend graduate school.
The College at Brockport community comprises approximately 7,166 undergraduate students and 1,247 graduate students. Brockport students are educated, guided and supported by 595 full and part‐ time faculty and 758 full and part‐time professional staff. This report, as we mentioned earlier presents data exclusively about the student body. Future reports will extend the research to include faculty and staff.
The data presented in this report was collected in late fall 2012 and spring 2013. With the cooperation of The College at Brockport’s Office of Research, Analysis, and Planning, we were able to draw a random sample of 800 Brockport students who received an on‐line survey about their civic engagement. The response rate to the survey was approximately 20%. We did encounter some response bias, illustrated in the disparities between the college population and our sample presented in the data below. Some differences worthy of consideration include; a 10% greater representation of full time students in the sample; a 9% greater representation of women in the sample; and a 28% greater representation of on‐campus students in the sample. In the presentation of the data that follows, in many instances we account for some of these differences by controlling for various factors such as gender, and campus residence.


Percentage of the College at Brockport Student Body and Our Sample for Various Characteristics
|
College |
Sample |
College |
Sample |
||
|
Full Time |
82.3 |
92.9 |
Students by School Within the College |
||
|
Part Time |
17.6 |
7.1 |
Arts, Humanities & Social Sciences |
21 |
27 |
|
Undergraduate |
86.3 |
88.4 |
Sciences & Mathematics |
18.4 |
28.9 |
|
Graduate |
13.7 |
11.6 |
Health & Human Performance |
28.4 |
16.4 |
|
On Campus |
38.0 |
66.9 |
Education & Human Services |
16.5 |
16.4 |
|
Off Campus |
62.0 |
33.1 |
Business Administration |
12.8 |
10.5 |
|
Male |
43.6 |
34.0 |
Undeclared |
2.9 |
0.7 |
|
Female |
56.4 |
65.4 |
Arts, Humanities & Social Sciences |
21 |
27 |
|
Over 25 Years |
15 |
7.8 |
|||
Service, in terms of Civic Health and engagement, is an act or project intended for the common good. Service can be performed by individual volunteers or groups, and benefit the community or institutions within the community. Service acts are typically co‐curricular, or extra‐curricular, though service can be integrated into service‐learning courses in which students earn academic credit for their volunteer experiences. Examples of service include volunteering at a local animal shelter, renovating a children’s playground, acting as a mentor, or painting a mural for a nursing home.
Volunteering and Service among Brockport Students with Comparisons to Citizens Nationally, in New York State and the Millennial Generation
Brockport Students
% Participating
Comparison Data % Participating
Volunteer Rate1
Made Donation of $25 or more (cash or equivalent)2 Worked with Neighbors to fix a community problem2
54.9
National
27
NY State
20
Millenials
21
36.1
50
42.4
NA
28.29
8.1
6.3
Type of Organization ‐ Proportion of All Volunteers1
- Comparison data is from the Corporation for National and Community Service in America Report, “Civic Life in America” available at, http://www.volunteeringinamerica.gov
- Comparison data comes from “2011 New York Civic Health Index” available through the National Conference on Citizenship, http://www.ncoc.net/NY Occasionally” includes those who responded “a few times a month” or “once a month.”
Table 1.1
|
Religious Organization |
10.2 |
34.4 |
26.5 |
28.4 |
|
Educational or Youth Service |
33.1 |
26.6 |
27.9 |
30.2 |
|
Social/ Community Service |
17.3 |
14.2 |
15.2 |
14.9 |
|
Civic/Political |
7.6 |
5.5 |
5.3 |
4.8 |
|
Sport/Hobby/ Cultural/ Arts |
15.8 |
3.6 |
4.8 |
3.5 |
|
Health Care Related |
8.1 |
8.2 |
11.1 |
9.8 |
|
Other/Unknown |
7.6 |
7.4 |
9.3 |
8.5 |
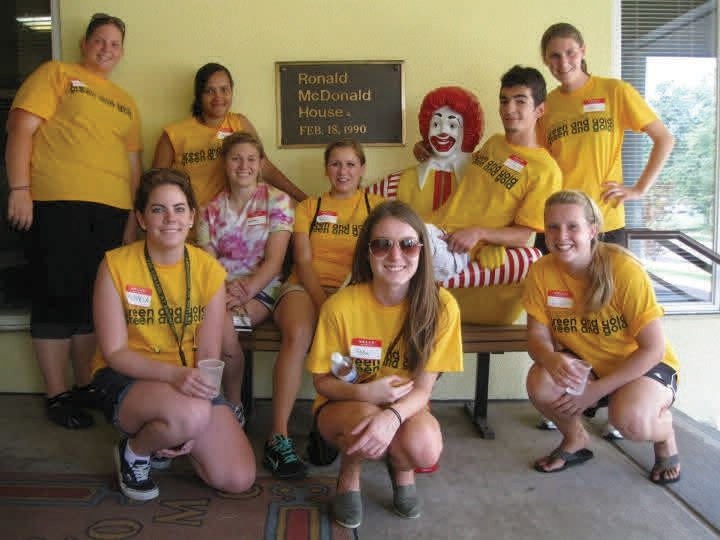
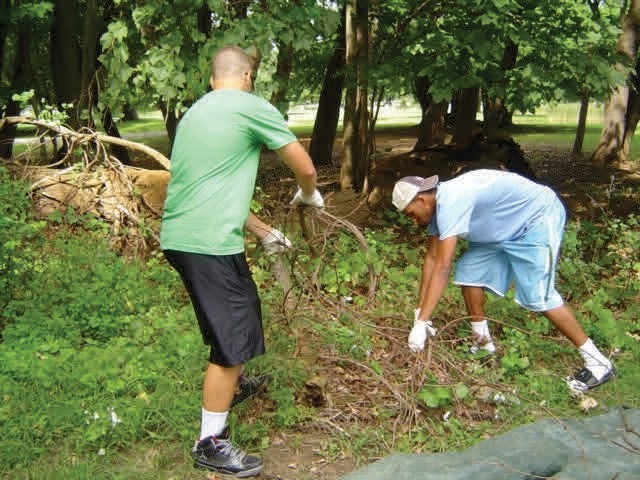
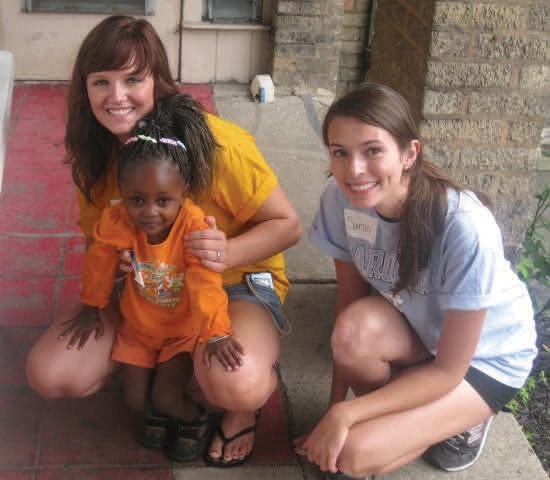
The College at Brockport is in good Civic Health when it comes to the rate at which students volunteer formally through organization and informally by working together to fix a community problem.
Just over half of Brockport students have volunteered at some point in the last year. This compares with 27% of citizens nationally, 20% of New York residents and 21% of millennials. Fewer students at Brockport, approximately 28%, worked together with their neighbors to fix a community problem. This is still an impressive number when compared to the 8.1% of citizens nationally and 6.3% of state residents who reported participating informally to aide their communities.
Unsurprisingly, given the tight budgets of most college students, the Brockport community lags behind the state and nation a little in the proportion of individuals who have given $25 (or equivalent in goods) to charity. That said, more than a third, 36.1% of Brockport students, had made such a contribution.
The College at Brockport students differ from citizens more generally in two key ways when it comes to the type of organizations with which they choose to volunteer. First, while about a third of volunteers nationally do so through religious organizations, much fewer – 10.2% ‐ of Brockport students do so. In contrast, sports, recreation and arts organizations are more popular places to volunteer among students (15.8%) than among citizens nationally (3.6%).
Differences in the types of volunteer activities most common among Brockport students, and citizens more generally, follow from their respective choices of volunteer organizations. Youth mentoring, coaching, and artistic performances are among the most popular volunteer activities for Brockport students, yet they do not feature strongly among
[For the Common Good…]
Most Popular Volunteer Activities among Students and Citizens Nationally
|
Table 1.2 |
|
|
Brockport Students % of Volunteers Performing Activity Mentor youth 17.44 Coach/referee/supervise sports teams 16.28 Fundraise or sell items to raise money 10.47 Music/ performance/artistic activity 10.47 General labor/provide transport 8.14 Tutor or Teach 6.98 Counselling/medical care 6.98 Collect /distribute/goods NOT food 5.81 General Office Services 5.81 Collect/prepare/distribute/serve food |
National % of Volunteers Performing Activity1 Fundraise or sell items to raise money 26.6 Collect/prepare/distribute/serve food 23.5 General labor/provide transport 20.5 Tutor or teach 19.0 |
|
1. National data comes from the “Civic Life in America: Key Findings in the Civic Health of America 2010” available through the National Conference on Citizenship, http://www.ncoc.net/National |
|
Does Group Participation Increase Volunteering and Informal Service?
|
Table 1.3 |
|
Was Student a Member of Any Group? Did Student Volunteer? Yes 66.7 31.4 100% No 33.3 68.6 100% Total 100.0% 100.0% 100.0% χ 2=17.106, p value = 0.00 Did Student Work with Neighbors to Fix a Community Problem? Yes 35.6 13.7 100% No 64.4 86.3 100% Total 100.0% 100.0% 100.0% χ 2=8.025, p value = 0.005 |

What explains why some Brockport students volunteer and work together to fix common problems while others do not? One factor that seems to make a difference is group membership. Two‐thirds of students who are members of a group volunteered in contrast to about a third of students who do not participate in a group. Similarly while a little more than a third of group members worked together informally to fix a community problem only 13.7% of non‐group members did so. One thing that may account for this difference is that the most common reason that students gave for why they became involved with volunteering was that they were asked (42%). Belonging to a group may make it more likely that you will be called upon by an organization to serve as a volunteer.
[For the Community…]
Does campus residence increase informal service?
Did Student Work with Neighbors to Fix a Community Problem?
Did Student Live On Campus?
Table 1.4
|
Yes |
38.2 |
8.0 |
100% |
|
No |
61.8 |
92.0 |
100% |
|
Total χ 2=15.120, p value = 0.00 |
100.0% |
100.0% |
100.0% |
 Living on campus is also a factor that promotes community service – however only in informal ways. There is no significant difference in the proportion of students living on and off campus who volunteer through organizations. However, living on campus makes students much more likely to work together to fix a common problem. A very impressive 38.2% of on campus residents collectively resolved community concerns while only 8% (a figure very close to the national rate) of off campus did so. It may be that the campus environment empowers students to feel they can be problem solvers, while in the wider community they lack similar empowerment. This seems like an opportunity for improvement for members of the Brockport community, especially so if we see our role as educators to prepare students to be effective citizens in the wider world upon graduation.
Many people believe that volunteering and other service activities are the only way to stay involved. However, participating in a group is considered a strong indicator of civic engagement. Group participation facilitates the building of community ties and builds bridges between individuals, communities and government. Academics from Alexis De Tocqueville to Robert Putman have noted the importance of participation in groups and organizational memberships to the vibrancy of democracy.
Group Participation among Brockport Students with Comparisons to Citizens Nationally, in New York State and the Millennial Generation
|
Table 2.1 |
||
|
Brockport |
Comparison Data % Yes National NY State Millenials1 37.9 36.7 38.8 10.6 7.8 12.6 N/A N/A N/A 9.2 8.8 N/A |
|
|
Activity |
Students % |
|
|
Yes |
||
|
Are you a member of |
62.2 |
|
|
any group? 2 |
||
|
Have you served on a |
25.0 |
|
|
committee?2 |
||
|
Have you attended a |
63.0 |
|
|
group meeting? |
||
|
Have you attended a |
15.0 |
|
|
community meeting?3 |
||
3 Comparison data comes from “2011 New York Civic Health Index” available through the National Conference on Citizenship, http://www.ncoc.net/NY |
||
Belonging to a group can have an important impact on one’s civic engagement. Indeed, group participation in of itself is a sign of engagement.
Moreover, it has been noted by political scientists that young people are more likely to join groups than any other form of political activity. This is certainly true for students at The College at Brockport. Over 60 percent of respondents report belonging to some kind of group. This level of participation is considerably higher than all three of our points of comparison (on average 25% more students are group members than citizens nationally, residents of New York and among Millennials).
The difference between Brockport students and Millennials is of particular note, however it may be explained by the ready access to a variety of groups on campus as well as the impact of higher education.
[Belonging…]
Type of groups Brockport Students belong to in Comparison to Citizens Nationally, in New York State and the Millennial Generation
|
Table 2.2 |
||
|
Brockport |
||
|
Group Type |
Students % Members |
Comparison Data % Members2 |
|
National NY State Millenials1 |
||
|
Sports and Recreation |
50.0 |
11.4 10.2 9.3 |
|
Service or Civic Organization |
9.0 |
7.7 6.0 8.5 |
|
School Group |
12.0 |
15.8 13.2 15.8 |
|
Church/Religious Organization |
20.0 |
20.6 18.5 20.9 |
|
Other |
12.0 |
5.8 6.1 6.7 |
|
||
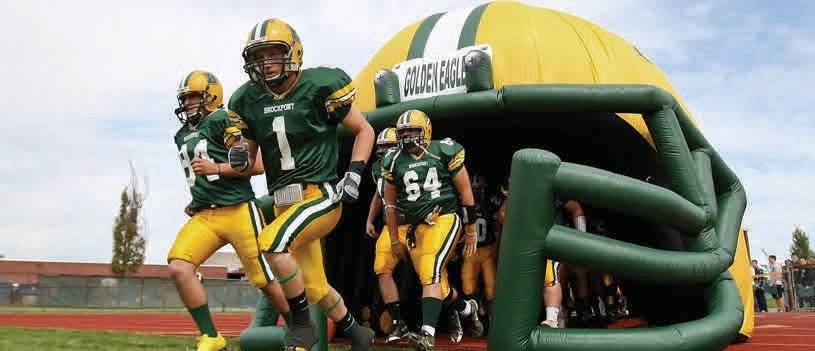
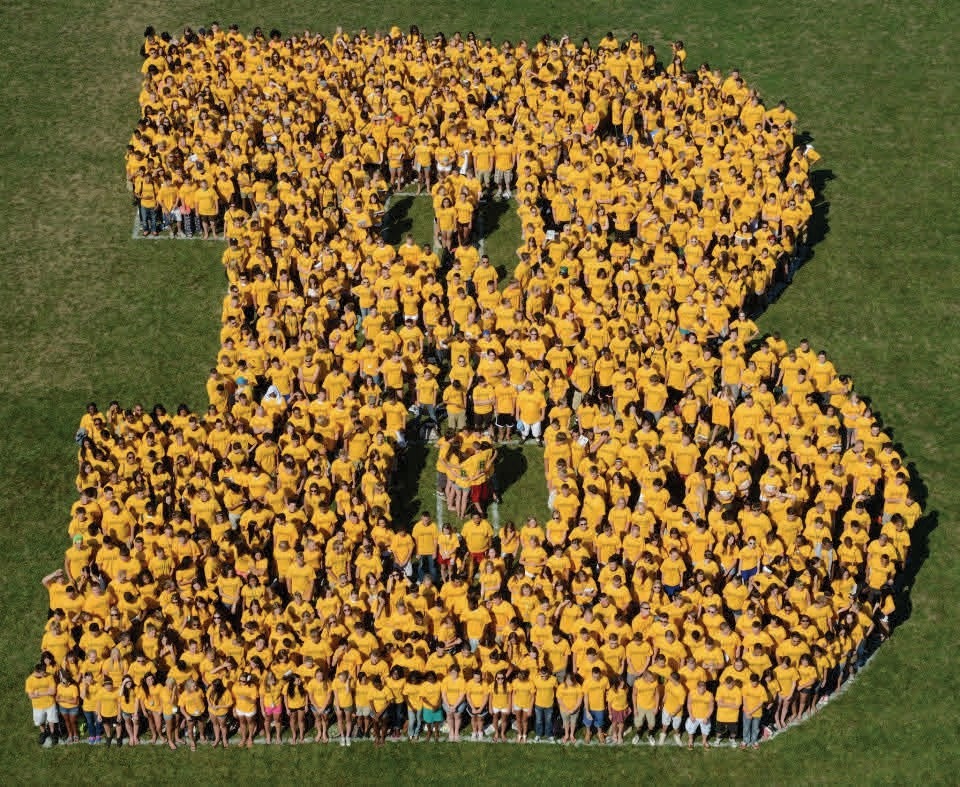 The types of groups’ students report belonging to certainly reflect the campus context, indeed 50 percent of students belong to a sports or recreation group dwarfing the similar group membership for the nation (11.4%), state (10.2%) and Millennials (9.3%). Students are also slightly more likely to belong to a service or civic organization (9%) than our comparison groups (7.7% of citizens nationally, 6.0% of New York state residents and 8.5% of millennials). Again, this type of group may be much easier to identify and join when living on campus than when residing in the broader community.
In future assessments of the Civic Health of Brockport we plan to gain more useful information by including additional categories (for example sororities or fraternities) and asking whether membership was voluntary or required (for example as part of a service learning course).
[Get involved…]
Does Living on Campus Promote Group Participation?
|
Table 2.3 |
|||
|
Do you live on campus? |
|||
|
Are you a member of any group? |
Yes |
No |
Total |
|
Yes |
72.8 |
52.9 |
66.2 |
|
No |
27.2 |
47.1 |
33.8 |
|
Total |
100.0% |
100.0% |
100.0% |
χ2=6.024, p value = 0 .014
Exploring the relationship between place of residence and group membership allows us to obtain a better understanding of the importance of the campus context. While it is already established that Brockport students have extraordinary high joining rates we can see that living on campus heightens the proclivity to do so. Indeed an impressive 72.8% of students who live on campus are members of at least one group.
This is about 20 points higher than for students who live off of campus.
Choosing to live in a dorm seems to play an important role in the engagement of students measured by group participation; we continue to examine the importance of campus residence as we present data on other dimensions of civic engagement throughout this report.
In order for a person to learn about the status of their community, and beyond that to the nation, they must have access to information. Indicators in this section assess whether, where, and how frequently people gather news about civic affairs. People may encounter information from many sources so we include measures of access to newspapers, television, radio and internet sources.
Connecting to Information among Brockport Students With Comparison to Citizens Nationally
|
Table 3.1 |
||
|
Type of News |
Brockport Students % Responding Frequently1 Occasionally2 Never3 67.3 N/A N/A 18.7 29.7 51.6 49.0 37.0 14.0 26.0 33.7 40.3 28.1 32.1 39.9 |
National Citizens % Responding3 Frequently Occasionally Never N/A N/A N/A 17.0 21.0 62.0 86.0 6.0 8.0 55.0 12.0 34.0 20.0 9.0 34.0 |
|
Any Source |
||
|
News Magazine |
||
|
Television News |
||
|
Radio News |
||
|
Internet News |
||
|
||
Brockport students’ connection to the news is good! An impressive 67 percent of Brockport students indicate they “frequently” gather news from at least one source. This is an important figure because the news serves as a mechanism for students to learn about the world at large and to become civically engaged. Among Brockport students the most popular source for news is television with 49% reporting they are “frequent” consumers of TV news. Radio and internet news sources virtually tie for second place in terms of popularity with 26%, and 28%, of students as “frequent” consumers respectively. News magazines are the least popular source, only 18.7% of students report consulting them “frequently.” These results differ somewhat from the national statistics. In the nation at large television is still the most frequently accessed source of news but a much higher percentage of citizens, 86 percent, report “frequently” consuming TV news.
Similarly radio is a much more popular source of news among citizens nationally with twice the rate (55%) of frequent consumers than among Brockport students. The reverse is true for internet as a news source, approximately 10% fewer citizens nationally (20% in total) report frequent use than among Brockport students. While we do not have data to draw comparisons to news consumption among state residents or the millennial generation it is likely that they would mirror the overall trend found among Brockport students and the nation as a whole, with television news being the most popular source despite the rise of alternative news outlets.
Does Living on Campus Impact Students Connection to News and Current Affairs?
|
Table 3.2 |
|
Does Student Live on Campus? Does Student get news frequently? Yes No (from any source) Yes 61.20 82.40 No 38.80 17.60 Total 100.0% 100.0% χ2 =7.059, p value = 0.008 |
Does Students Gender Impact Connection to News and Current Affairs?
|
Table 3.3 |
|
Gender Does Student get news frequently? Female Male (from any source) Yes 61.8 77.4 No 38.2 22.6 Total 100.0% 100.0% χ2 =3.842, p value = 0 .05 |
Living on campus seems to have an impact on various components of the civic health of Brockport students, for example it increases their propensity to join a group, and also promotes higher levels of social connection. However, that is not the case when examining students’ connection to the news. Indeed while 61.2 percent of students who live on campus report frequent news access, proportionally more 82.4 percent, of those who live off campus are frequent news consumers.
News consumption also differs by gender, women are less likely than men to report accessing the news frequently. Men have an almost 16 point advantage with 77.4% reporting “frequent” consumption in contrast to 61.8% of women. However when we consider these two factors (place of residence and gender) together we uncover an intriguing relationship (see Table 3.4).
[Connect…]
While fewer female students in general access news compared to male students, female students who live on campus are significantly less likely to consume news frequently than their off‐campus counterparts. A surprisingly high proportion, 84.4 percent of female students off campus report “frequent” news consumption, in contrast only a little more than half (52.9%) of female campus residents “frequently” access news.
This residency effect does not appear to hold among male students – in fact there is only a 2.4 percent difference among men who live on and off campus with regard to “frequent” access to the news (76.5 percent versus 78.9% respectively). Thus we can see that controlling for gender is crucial to fully understanding the relationship between campus residence and connecting to news.
Male students, regardless of place of residence, are accessing information. Female students, however, are much less likely to “frequently” consume news when they live on campus. This points to an exciting opportunity to try to improve news access among women on campus and thus by extension enhance their likelihood to be politically engaged. This is a real opportunity because as we report in subsequent sections reading the news is an indicator of likely participation in both voting and non‐electoral political activity.
Does Gender Impact Students Connection to News and Current Affairs?
|
Table 3.4 |
|
Does Student Live on Campus? Does Student get news frequently? Yes No (from any source) Female Students Yes 52.9 84.4 No 47.1 15.6 Total 100.0% 100.0% χ2 =9.224, p value = 0. 002 Male Students Yes 76.5 78.9 No 23.5 21.1 Total 100.0% 100.0% χ2 =0.043, p value = 0.836 |
Social connectedness refers to the ways that individuals connect with their family and community through everyday activities. Indicators in this category include such things as how often individuals eat dinner with family and friends, talk to and do favors for neighbors, as well as how many close friends they have. The activities in the category of social connectedness are informal, yet they are considered to be important in fostering social trust within a community as well as in creating social networks and generating greater participation in more formal communal activity. In formal ties are conduits for information exchange.
Social Connectedness among Brockport Students with Comparisons to Citizens Nationally, in New York State and the Millennial Generation
|
Table 4.1 |
|||||
|
College at Brockport percentage responding Frequently1 Occasionally2 Never |
Comparison Data % responding Frequently National3 NYS4 Millenials5 |
||||
|
Activity |
|||||
|
While Students are on Campus |
|||||
|
Eat Dinner With |
88.0 77.8 58.5 78.7 31.8 13.2 |
7.4 4.6 89.1 14.8 7.4 45.8 19.8 21.7 16.2 While Students are off Campus 14.6 6.7 89.1 43.1 25.2 45.8 48.3 38.4 16.2 |
88.5 47.4 14.8 88.5 47.4 14.8 |
82.0 45.1 11.0 82.0 45.1 11.0 |
|
|
Fellow Students |
|||||
|
Talk with |
|||||
|
Neighbors |
|||||
|
Do Favors for |
|||||
|
Neighbors |
|||||
|
Eat Dinner with |
|||||
|
Household |
|||||
|
Talk with |
|||||
|
neighbors |
|||||
|
Do Favors for |
|||||
|
Neighbors |
|||||
|
|||||
When we think about social connectedness we are interested in the extent to which students are engaged in the community around them. Living a connected life suggests that students are engaged in the world beyond campus and in turn may become participants in other forms of civic engagement. We can see a striking difference among students living on campus and those who live off campus in terms of social connectedness.
As Table 4.1 illustrates, there is an almost 10 percent difference in students reporting eating dinner “frequently” with friends on campus (88%) compared to those who report they eat “frequently” with household members (78%). While family members are not the same as friends, clearly friends play a sim‐ ilar role to family members for students living on campus.
One factor that may explain the difference in fre‐ quency of dining with friends (on campus) over family members (when living at home) is that the pool of friends that students can draw upon is clearly larger than the typical family. Indeed our data show that students living on campus have an average of 7.75 “close” friends (see Table 4.2). This compares to an average of 5.32 “close” friends for students living off campus. In addition to having more friends, and din‐ ing with them more often, students when on‐campus are more likely to talk with, and do favors for, their neighbors.
If we look at students social connectedness in com‐ parison to citizens nationally, in New York state, and among the millennial generation we find that while on campus, students are more social connected than comparison groups; however when Brockport students are off‐campus they are generally less well socially connected than comparison groups. For example, 31.8% of Brockport students report talking “frequently” with neighbors when off‐campus compared to 45.8% of citizens nationally, 47.4% of New York state residents and 45.1% of Millennials. A simi‐ lar pattern holds for eating dinner “frequently” with household members, 78.7% of Brockport students report doing so when off campus contrasted to 89.1% of citizens nationally, 88.5% of New York State resi‐ dents and 82% of Millenials. When they are off cam‐ pus Brockport students do exceed their Millennial peers with regard to “frequently” doing favors for neighbors (13.2 report doing so, compared to 11.0% of all Millenials). However fewer Millenials overall “frequently” do favors for neighbors, and this small difference does not change the general trend of the results.
It seems that the College at Brockport campus envi‐ ronment is very positive with respect to fostering social connectedness among students. However, before drawing any conclusions about the impact of the campus environment on civic engagement broadly it is important to note that students who live on campus report spending less time talking about politics than those who live off campus (see Table 5.4).
How Many Close Friends do Brockport Students Have?
|
Table 4.2 |
|
Mean Range 95% Confidence Interval On Campus Students 7.75 0 ‐ 45 6.31 – 9.19 Off Campus Students 5.32 0 ‐ 12 4.46 – 6.18 |

Political Action refers to the many ways that citizens participate in politics. These activities include both formal and informal ways that citizens can influence both national and local public policy and broader political outcomes. Voting is the most common aspect of political action and we capture voting participation in the 2012 election here, along with rates of voter registration. While it is much less common we also evaluate how many students are active in campaigns by distributing campaign materials, making donations or fundraising. We also assess political party affiliation and ideology. Non‐electoral forms of political action include such activities as contacting a public official, taking part in a protest or rally, buying or boycotting a product for political reasons, attending a meeting where politics is discussed or discussing political issues with family and friends.
Political Action among Brockport Students with Comparisons to Citizens Nationally, in New York State and the Millennial Generation
|
Table 5.1 |
|||
|
Activity |
Brockport Students % Yes |
Comparison Data % Yes |
|
|
National NY State |
Millenials1 |
||
|
Electoral Activity2 |
|||
|
Registered to Vote |
64.1 |
65.1 59 |
54.7 |
|
Voted |
39.7 |
56.5 50.9 |
42 |
|
Distributed Campaign Materials |
16.2 |
N/A N/A |
N/A |
|
Non Electoral Activity3 |
|||
|
Discussed Politics with Family/Friends |
80.8 |
73.6 62.5 |
69 |
|
Contacted a Public Official |
11.0 |
10.4 10.7 |
15.3 |
|
Attended a Meeting Where Politics Were Discussed |
22.2 |
10.3 N/A |
N/A |
|
Bought/Boycotted Goods/Services for Political Reasons |
19.6 |
10.7 10.7 |
12.8 |
|
Taken part in a March/Rally/Protest |
11.2 |
3.1 2.8 |
N/A |
3 Comparison data for non‐electoral participation is from the Corporation for National and Community Service in America Report, “Civic Life in America” available at, http://www.volunteeringinamerica.gov/NY |
|||
Political participation in the most traditional of ways ‐ voting ‐ as Table 5.1 illustrates, is not where Brockport students excel. While students at Brockport were registered to vote at almost equal rates to citizens on the state, and national level, their voter turn‐out was considerably lower than national and state rates (39.7% compared to 56.5% and 50.9% respectively). In comparison to their generational counterparts the Millenials, Brockport students were more likely to be registered to vote, but slightly less likely to vote (39.7% versus 42%).
One possible explanation for the relatively low turnout rate is the somewhat higher “cost” of voting to college students in comparison to other citizens. Unless students live off campus, or go to the effort to change their registration, voting can become quite burdensome in terms of the time and effort to get home to your local precinct, or to file for an absentee ballot. Indeed, when the data are examined by place of residence, 50% of students who live in the Rochester/Brockport area said they voted compared to only 36.1% of those students who did not live in the region.
In contrast to their lackluster voter turnout, Brockport students are more likely to participate in non‐electoral forms of political action than comparison groups. This is especially the case for discussing politics with friends and family. Almost 81% of students report that they talk about politics. The proportion of Brockport students engaging in political discussion is higher than that reported for the nation (73.6%), state (62.5) or Millennial generation (69%). Brockport students are also more likely than comparison groups to have bought or boycotted goods for political reasons, attended a meeting where politics are discussed and taken part in a protest or rally. It is perhaps not surprising that Brockport students’ propensity for non‐electoral activity exceeds that in the national and state given that research demonstrates younger generations are more likely to participate in “active” forms of political action than the more traditional voting. However it is worth noting the higher rates of Brockport students compared to the millennial generation as a whole; here we might be seeing the effect exposure to higher education as well as the campus environment having an impact.
Does News Consumption Influence Political Participation?
|
Table 5.2 |
||
|
Does respondent get news every day or a few times a week? |
||
|
Voted in the 2012 Election? |
Yes |
No |
|
Yes |
44.0 |
29.4 |
|
No |
55.2 |
70.6 |
|
Total |
100.0% |
100.0% |
|
χ2 =5.640 p value =0 .01 |
||
|
Bought or boycotted a product for political reasons? |
Yes |
No |
|
Yes |
24.8 |
8.3 |
|
No |
75.2 |
91.7 |
|
Total |
100.0% |
100.0% |
χ2=3.377 p value = 0.66
How does news consumption affect political activities such as voting and boycotting products for political reasons? Perhaps being an active consumer of the news provides students with information upon which to base a decision to participate in a boycott or reasons to vote. As Table 5.2 illustrates, this certainly appears to be the case among Brockport students with substantial differences in political action among readers and nonreaders. With respect to voting, 44.8% of frequent “news” consumers cast a ballot compared to 29.8% of those who infrequently consumed news. Similarly 24.8% of “frequent “ news consumers had bought or boycotted a product for political reasons compared to only 8.3% of their infrequent news gathering peers.
Does Group Membership Influence Political Participation?
|
Table 5.3 |
||
|
Did respondent participate in a group of any kind? |
||
|
Voted in the 2012? |
Yes |
No |
|
Yes |
35.3 |
48.1 |
|
No |
64.7 |
51.9 |
|
Total |
100.0 |
100.0 |
|
χ2=2.353, p value = 0 .125 |
||
|
Bought or Boycotted a product or service for political reasons? |
Yes |
No |
|
Yes |
13.9% |
30.8 |
|
No |
86.1% |
69.2 |
|
Total |
100.0% |
100.0 |
χ2=6.225, p value = 0 .013
Surprisingly, while “frequent” news consumption boosts students’ political action, the same relationship does not hold up for students who participate in group activities. Indeed, participation in a group appears to suppress both casting a ballot and boycotting goods or services for political purposes.
Voter turnout is actually 13% lower among those students who report being a part of a group (35.3% compared to 48.1%), while the difference is even larger for boycotting goods. Only 13.9% of those in a group said they boycotted goods or services for political reasons compared to 30.8% of those who do not participate in a group. These results suggest that group activity negatively affects political activity.
While we would not argue that students should resist joining groups it appears that there is potential for the Brockport community to encourage groups and their members to engage in political action of many different kinds.

Discussion of politics is another form of civic engagement. Talking about politics with friends and family is an important indicator of the extent to which students are paying attention to world events and believing that politics is important to their lives.
However, living on campus impacts this form of political engagement in ways similar to those noted above regarding belonging to a group ‐ indeed living on campus dampens civic engagement in the form of political talk. Among students who live off campus 66.7% report talking about politics among family and friends, however 15% fewer, just 51.5% of those living on campus report having such conversations.
Does Living on Campus Increase Political Discussion?
|
Table 5.4 |
|||
|
Do you live on campus? |
|||
|
Do you discuss politics with your family and friends? |
Yes |
No |
Total |
|
Often |
51.5% |
66.7% |
56.5% |
|
Occasionally |
26.2% |
19.6% |
24.0% |
|
Never |
22.3% |
13.7% |
19.5% |
|
Total |
100.0% |
100.0% |
100.0% |
χ 2=3.313, p value = 0 .191
55% of students at the College at Brockport volunteered for an organization in the last year. A rate higher than in the nation, state, or among the millennials.
Approximately 30% of students at the College at Brockport worked together with neighbors to fix a community problem.
Students who participated in groups, and students living on campus, were more likely to volunteer and engage in informal service in the community.
62% of students at the College at Brockport are members of a group of some kind – sports groups are the most popular.
67% of students at the College at Brockport access news at least a few times a week.
 Female students who live on campus are less likely to access news “frequently” than their male peers or female students living off campus.
Students who live on campus are more likely to eat dinner with friends, talk with neighbors and do favors for neighbors than their off‐campus peers.
Approximately 40% of College at Brockport students voted in 2012 – slightly lower than among millennials nationally.
Students who participate in groups are less likely to vote than their peers, while students who access news “frequently” are more likely to vote.
Students who live on campus are less likely to discuss politics than their peers living off campus.
Three Ideas for Improvement…
Encourage women living on campus to access the news more frequently.
Increase political discussion, especially on campus, and voter participation among all students.
Encourage group participation among students living off‐campus.
PLEASE SEND SUGGESTIONS AND COMMENTS TO:
Dr. Susan Orr ‐ sorr@brockport.edu
Dr. Dena Levy ‐ dlevy@brockport.edu
THANKS AND ACKNOWLEDGEMENTS
This project would not have been possible without the contributions large and small, of the following individuals and organizations. We thank them for their financial support and/or helpful cooperation.
The American Democracy Project National Staff and the Committee at Brockport The National Conference on Citizenship
Anne Hout and the Office of the Provost at the College at Brockport
Jeff Lashbrook and the Office of Institutional Research at the College at Brockport
The Institute for Engaged Learning , Summer Research Program at the College at Brockport The Office of Community Development at the College at Brockport especially Jeiri Flores The Leadership Development Program at the College at Brockport
The Department of Political Science and International Studies at the College at Brockport, especially students in Research Methods Fall 2012 and Spring 2013
